Forever 29: an age gap data analysis

Join us as we journey into Uncharted Territory—Feeld’s data blog dedicated to celebrating the curiosities, evolutions, and experiences of our members.
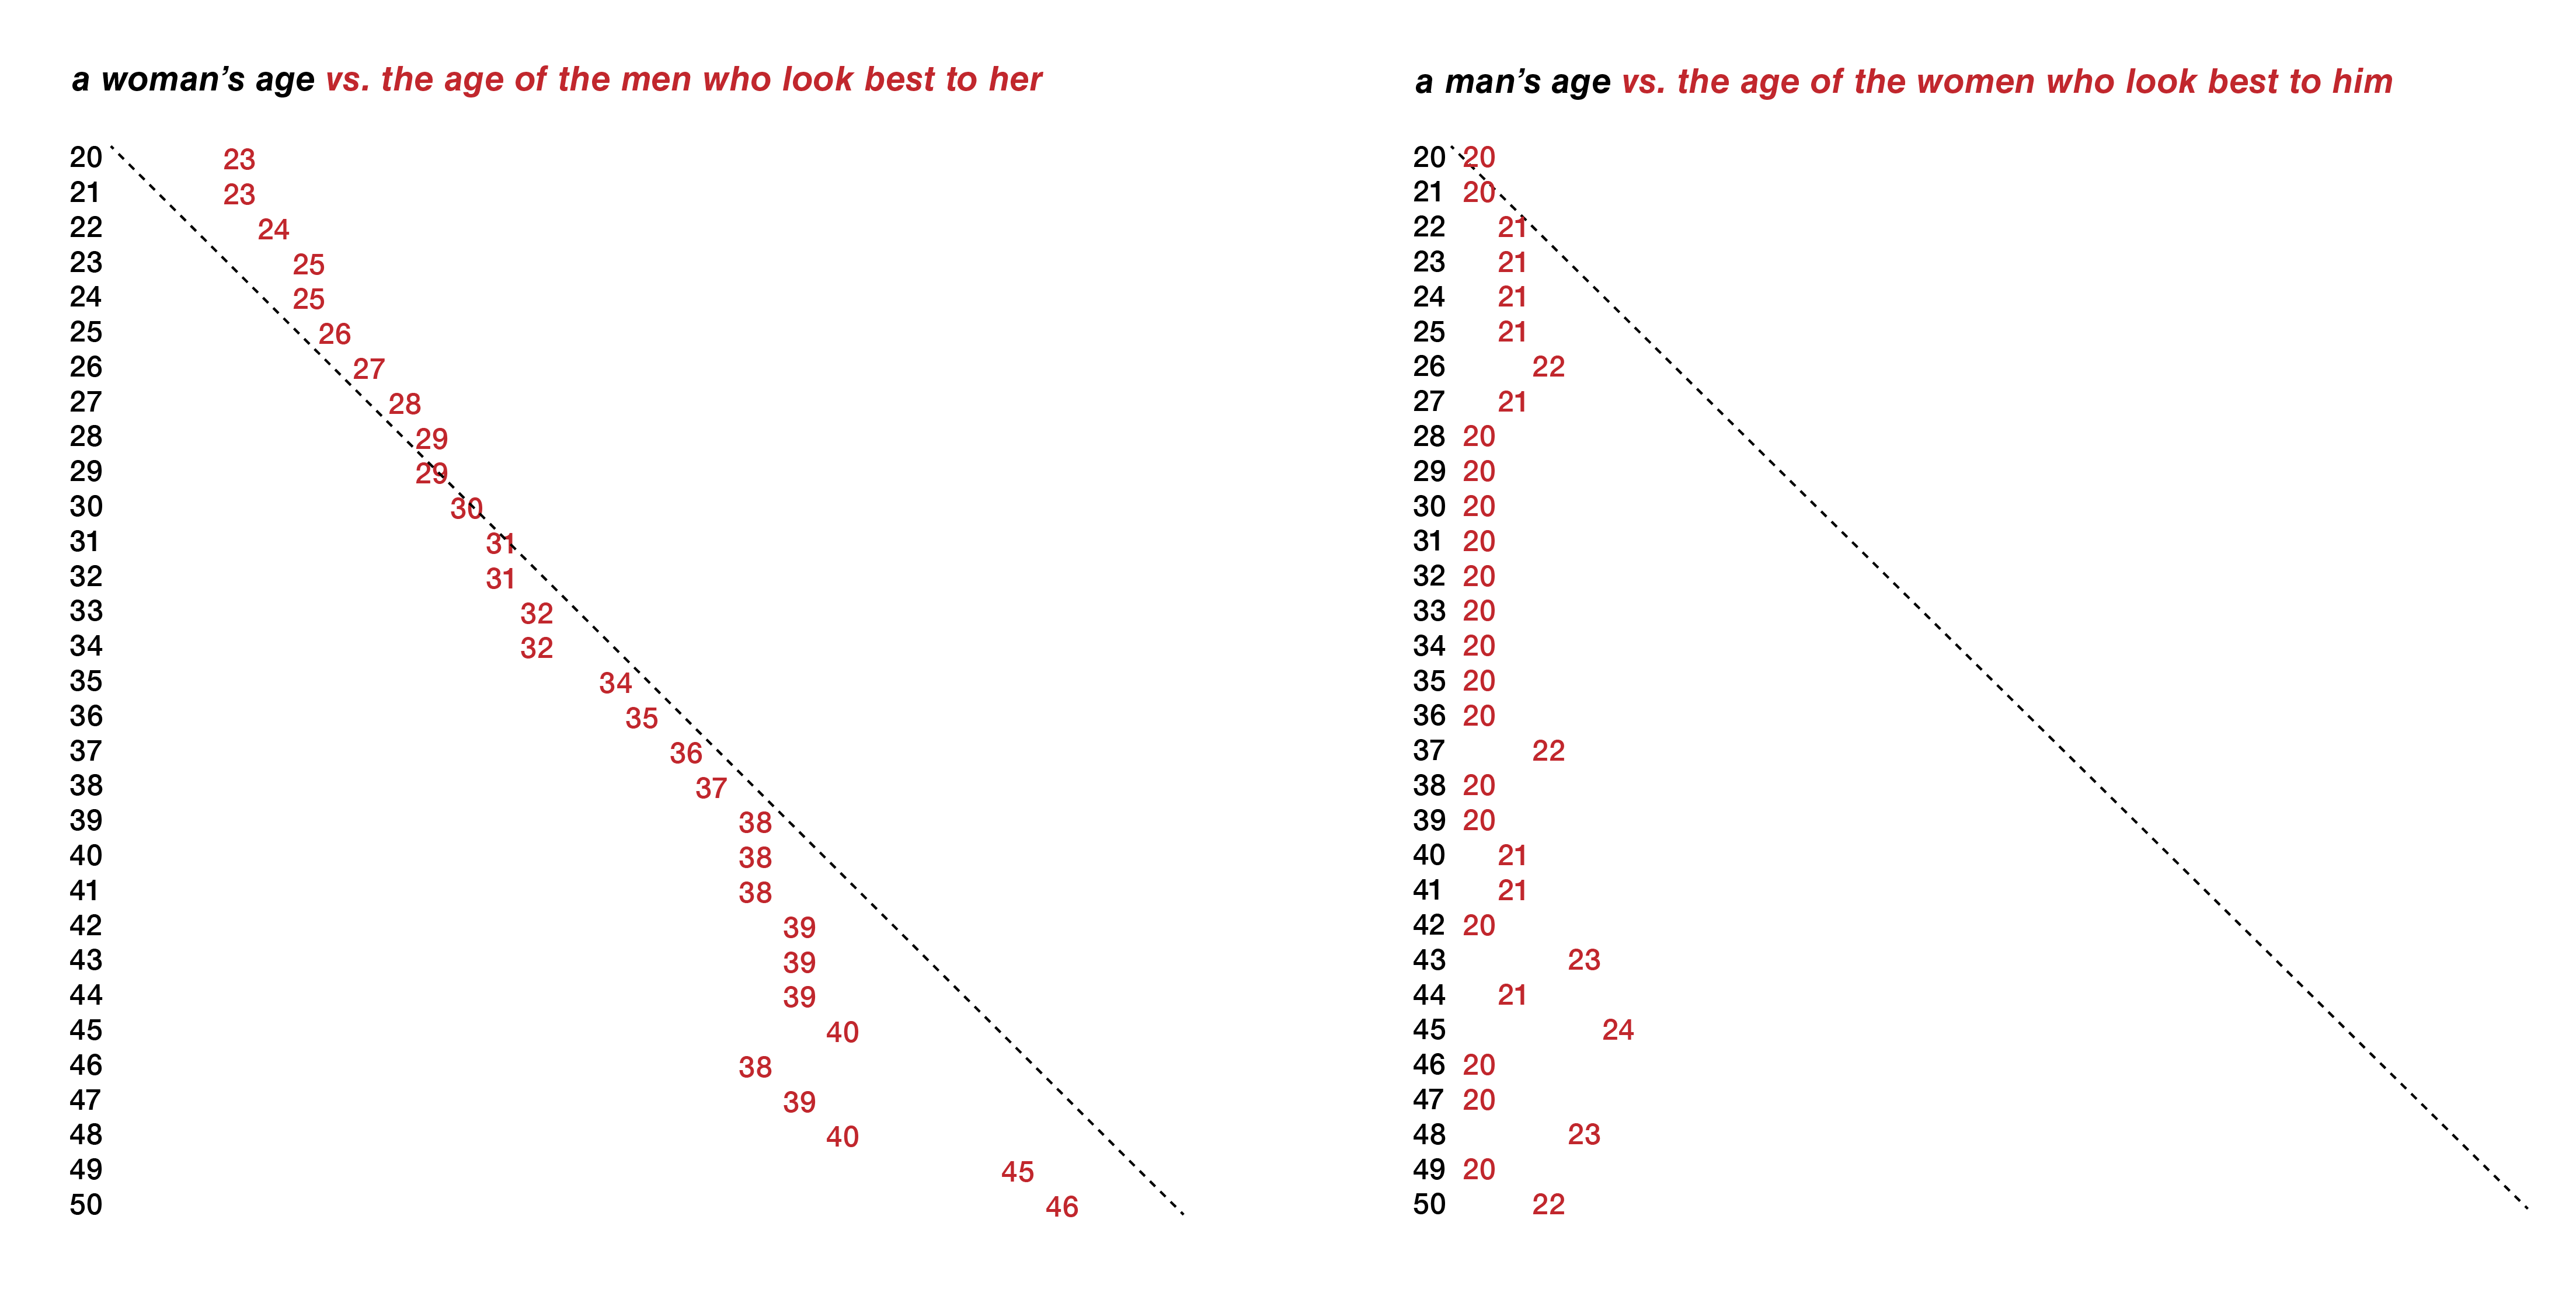
The 2014 book Dataclysm famously presented data showing that women tend to find men close to their own age attractive, whereas men tend to find primarily 21-year-old women attractive, regardless of their own age. This creates a dating disadvantage for many women because most men show less interest in them as they age.
We were curious if we could reproduce this analysis at Feeld. First of all, does this (straight, cisgender) men-vs-women age-preference dynamic exist on Feeld? Second, how can we add even more gender and sexuality nuance to the picture? And third, how does our members’ like-sending behavior compare to their in-app age range settings?
What we learned, in short
- Good news for Gen Z—Feeld members love a 29-year-old! On Feeld, all ages, genders, and sexualities send the most likes to those aged 28-32, with an average of 29. This is equally true for like-senders of all ages from 25 to 35 to 45. Gen Z is poised to be the primary beneficiary of this attention, creating more opportunities for meaningful connection.
- Cis men are more stubborn about sending likes to a small band of ages around 29. Cis women, by contrast, send likes to a wider band of ages around the average of 29.
- Overall, Feeld men and women are not all that different in their age preferences. In their early to mid-20s, every gender group sends likes to people slightly older than themselves. In their late 20s to early 30s, they send likes to those their own age. By the late 30s and beyond, they send likes to those younger than them. This pattern is generally true for all genders and sexualities on Feeld.
- Age preferences differ more by gender than sexuality. Straight, bi, pan, gay, and queer men all have much more in common with each other than with those of the same sexuality but a different gender. Unsurprisingly, the age preferences of non-binary and gender-nonconforming Feeld members fall in between those of cis men and women. But surprisingly, transgender men and women’s age preferences are both aligned more with those of cis women. Overall, cis men (especially straight, cis men) have the most outlying age preferences.
- Feeld members are generally optimistic when explicitly setting their age preferences in the Feeld app. They tend to set their ranges to accommodate much higher ages than they actually prefer to send likes to in practice. This is true for all genders and sexualities.
The vibe on Feeld is different
The truth about age preference for straight, cis men and women at Feeld is somewhere in the middle of what Dataclysm found about OkCupid’s users. At Feeld, both straight, cis women and men tend to send likes to people older and younger than themselves, and the difference is only in degree.
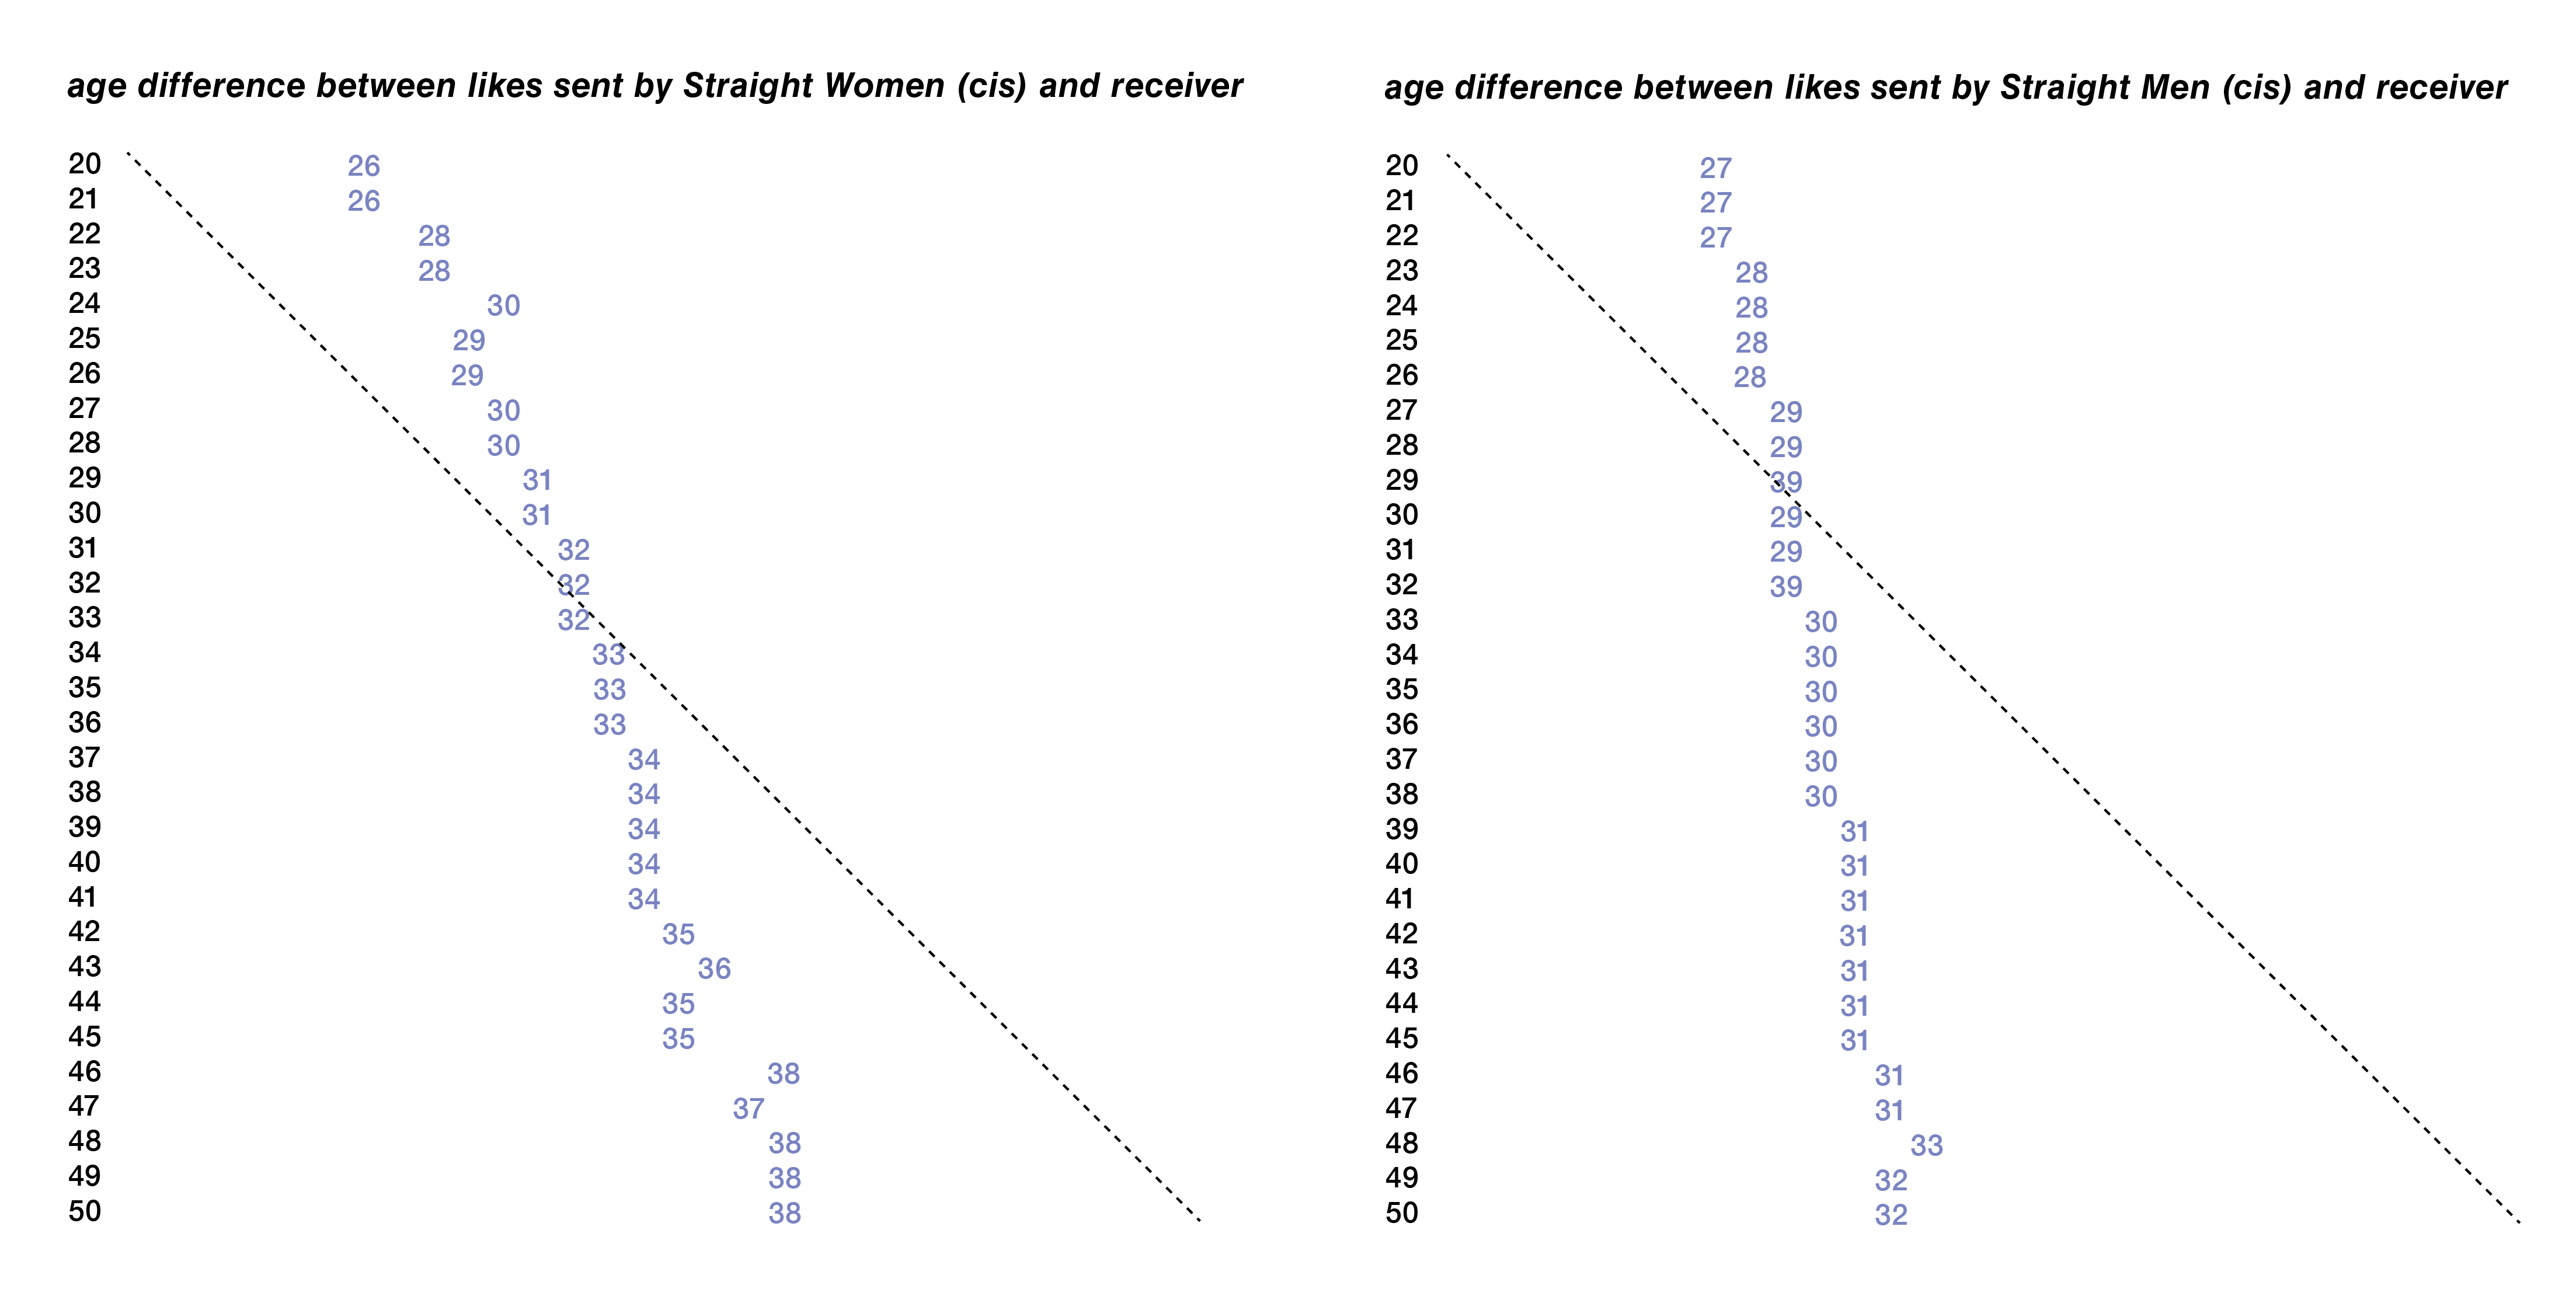
Compare the book’s findings for women on OkCupid (left) with those of straight, cis women on Feeld (right). The dotted line represents where the ages are equal.
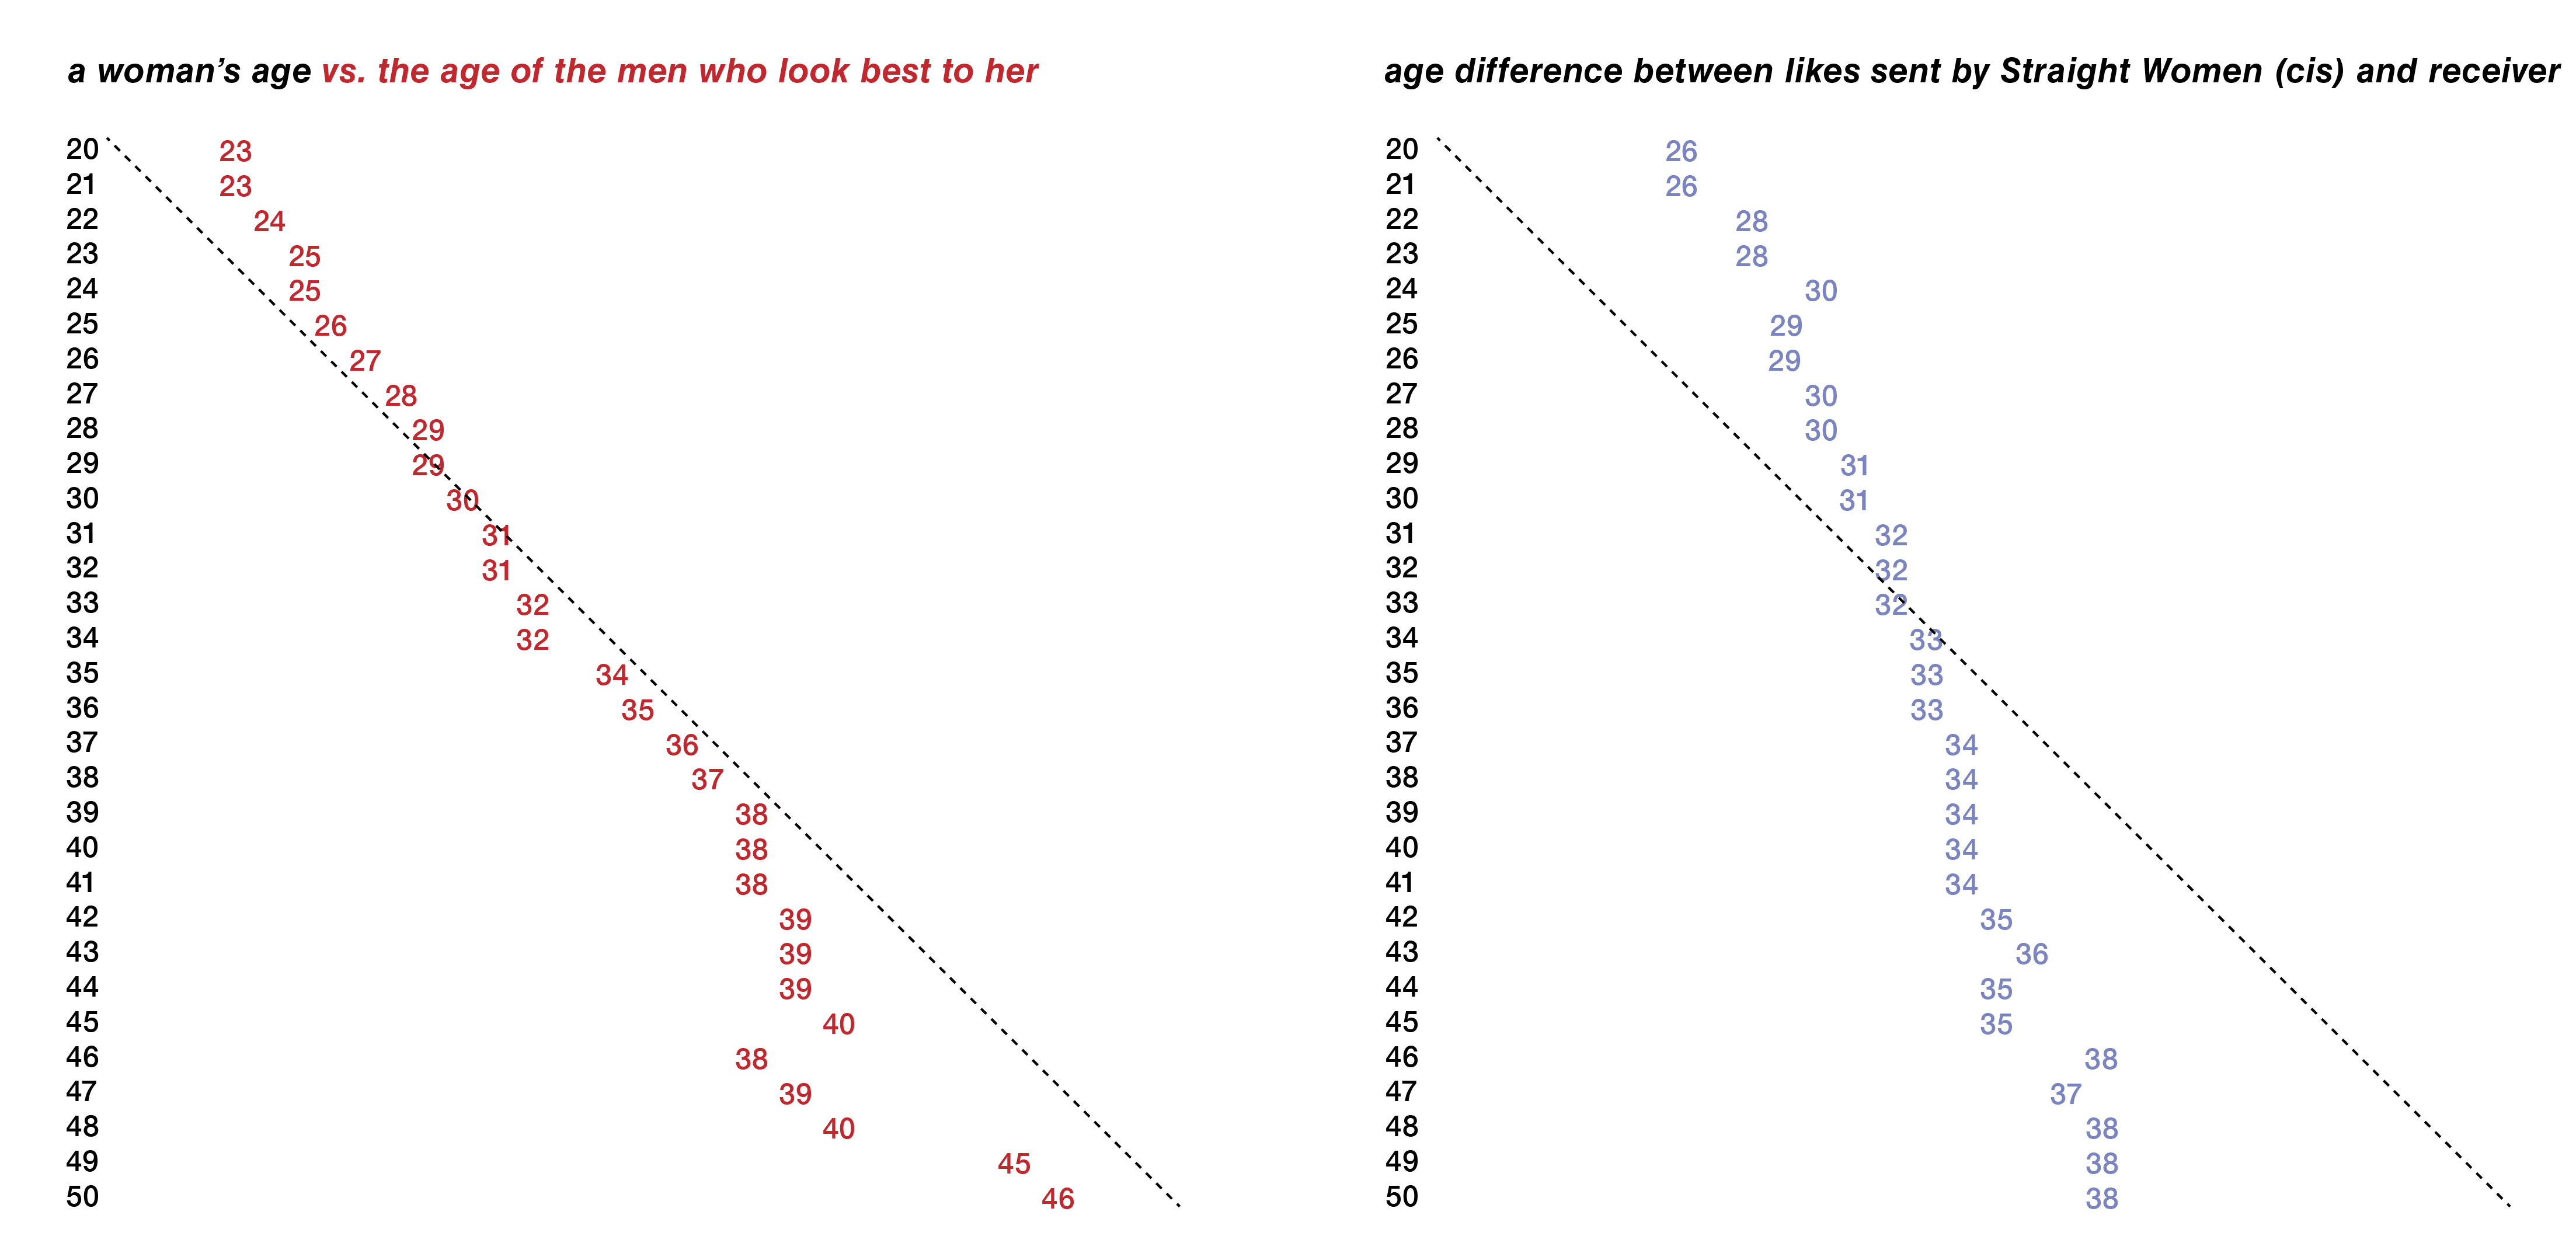
Notice that straight, cis women on Feeld send likes further outside of their own age more so than those on OkCupid (the red line is more vertical). These Feeld women tend to send likes to people older than themselves until their early 30s, when they send likes to people their own age. Starting in their late 30s and beyond, they send likes to people increasingly younger than themselves. This trend is somewhat noticeable but less pronounced for the OkCupid women.
Let’s look at straight, cis men on Feeld (right) compared to OkCupid (left).
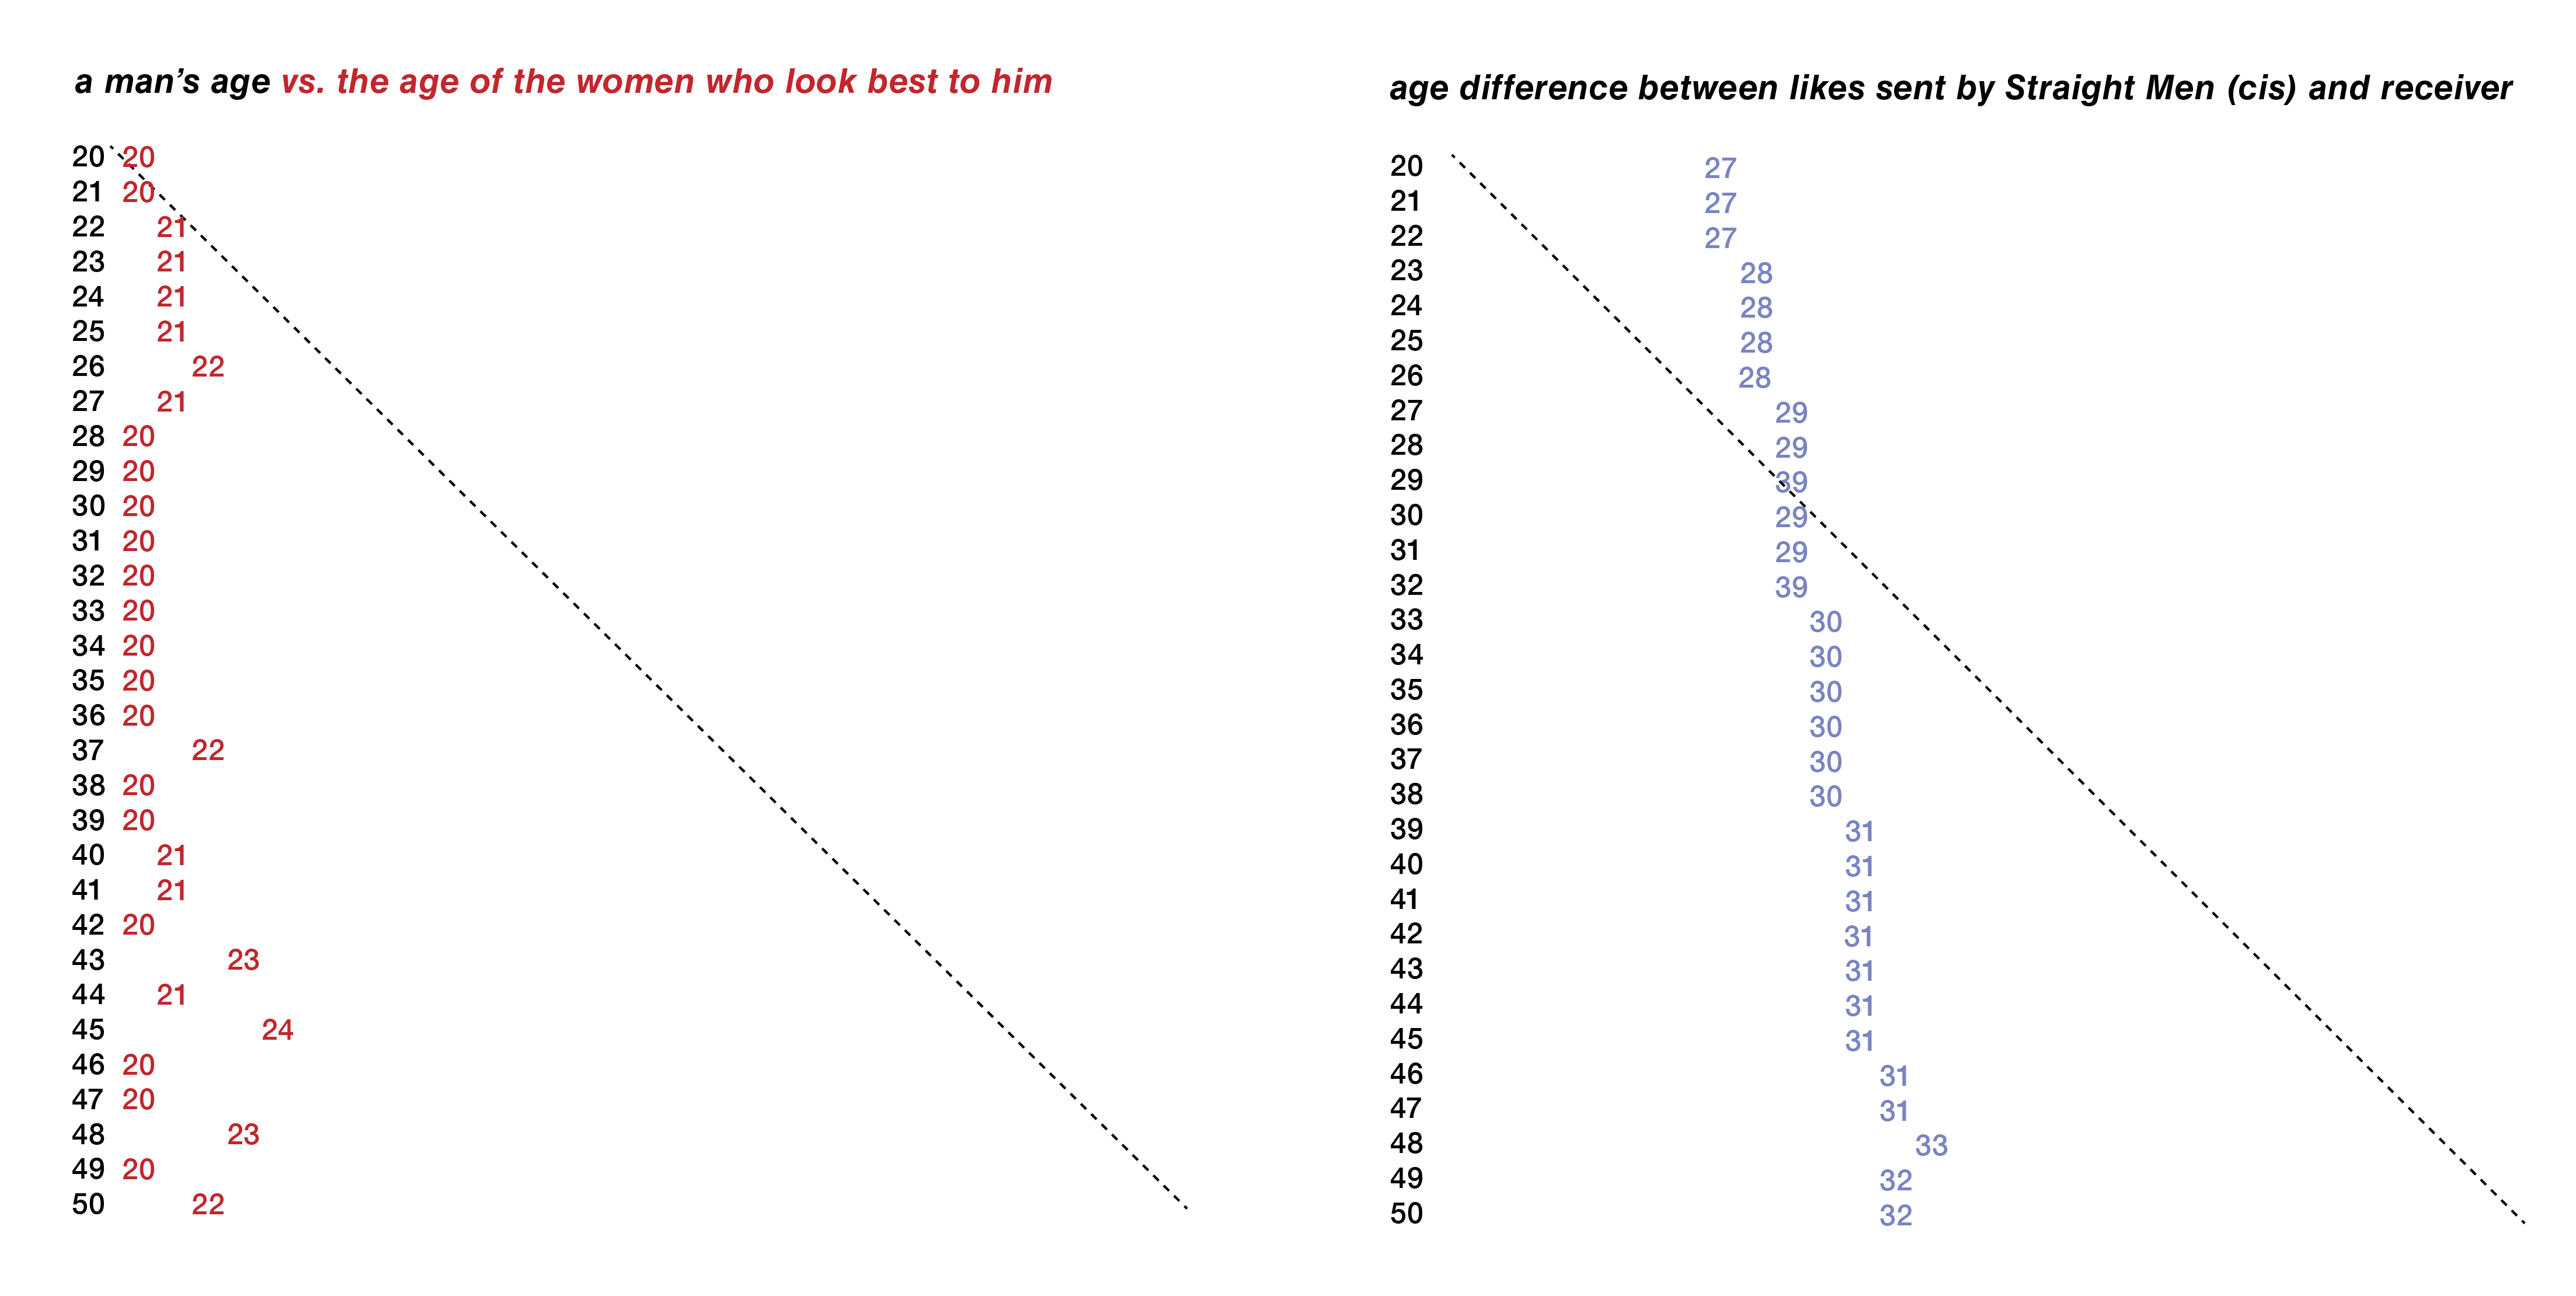
Although we see a similar vertical line pattern indicating that straight, cis men’s age preferences don’t change much as they age, at OkCupid this vertical line is centered around age 21, whereas at Feeld the line is centered around age 29—almost a full decade older. Straight, cis men on Feeld prefer to send likes to people in a much higher age band than those on OkCupid.
Men and women, not as different as we thought?
Recall the charts from Dataclysm showing extreme differences between men and women. Women follow the diagonal line (i.e. prefer men their age) while men follow a vertical line close to the left (i.e. prefer 21-year-olds regardless of their own age).
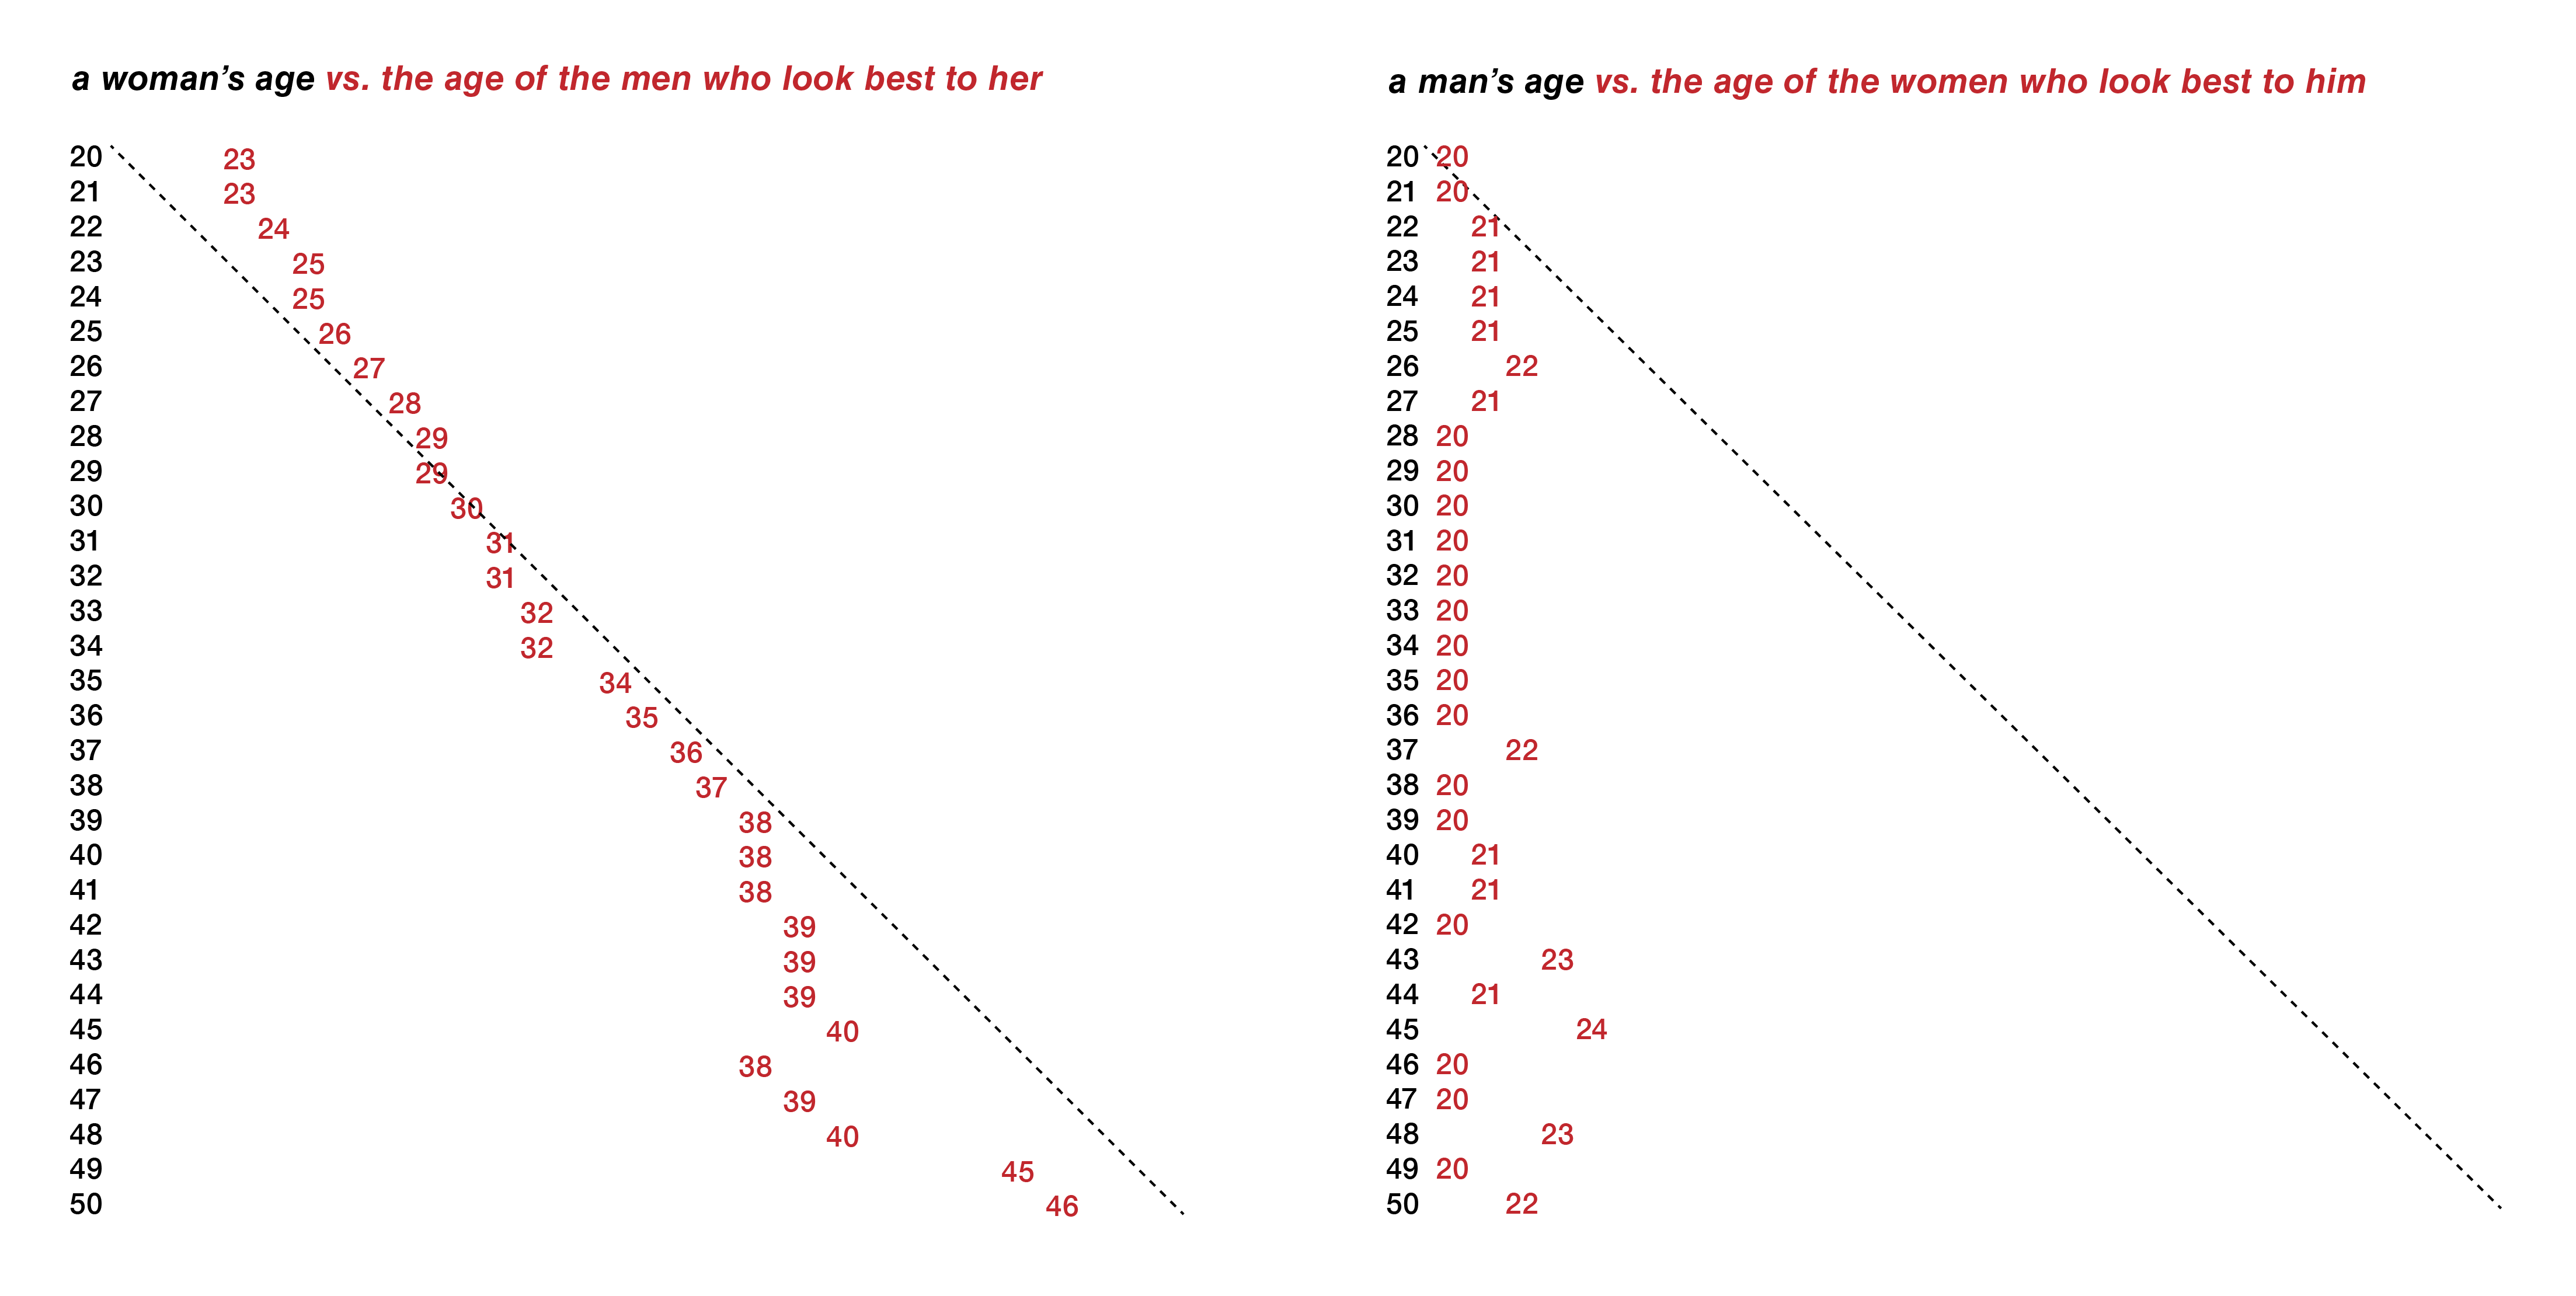
Here are the charts for straight, cis women and men at Feeld, side by side. Notice that they’re much more similar to each other than different.
Both the Feeld straight, cis women and men’s charts look like a blend of the charts from Dataclysm. They both show the clear disconnect between the age of the like sender and the receiver (like OkCupid’s men’s chart) but not so much that the difference between the ages is huge (like OkCupid’s women’s chart). Also, the universal preferences skew more toward people in their late 20s and early 30s, rather than people in their early 20s.
The world outside straight, cis men and women
At Feeld, we record myriad gender and sexuality options (20+ of each!) that allow us to add nuance to the picture of age relations.
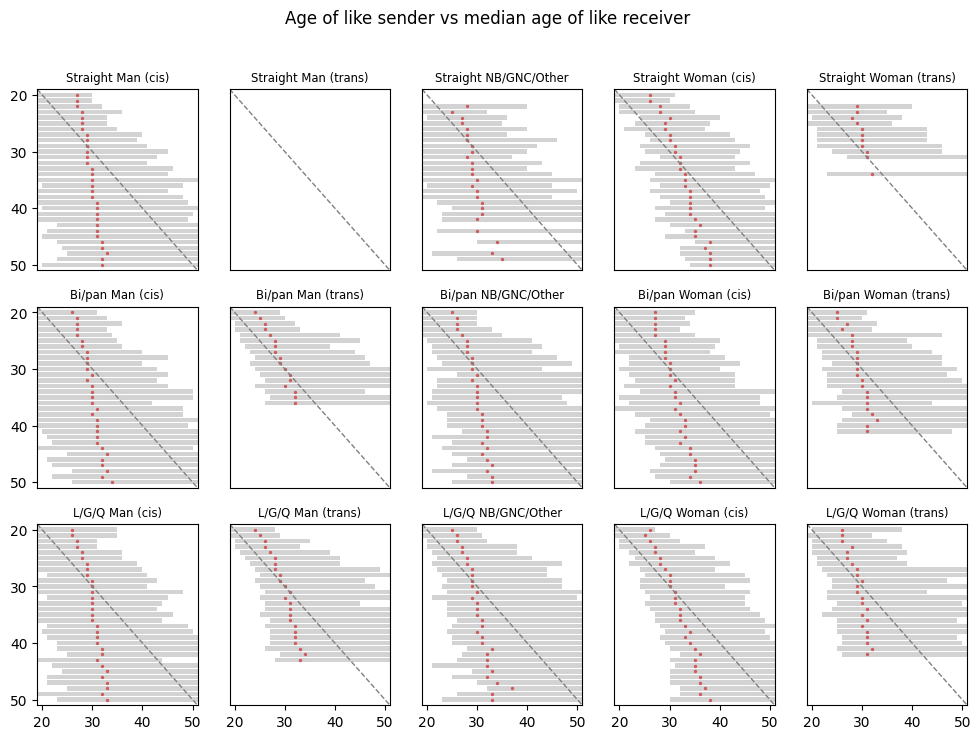
Here are the age comparison charts for several categories of genders and sexualities on Feeld. Each row represents a sexuality grouping (straight, bi/pan, and lesbian/gay/queer) while each column represents a gender (men—both cis and trans, non-binary and gender-nonconforming people, and women—again both cis and trans). Each chart is a combination of one gender and one sexuality.
Of course, we offer more options than this on the Feeld app but some categorization is necessary to make less cluttered visuals and also to produce a large enough sample to be confident of the results.
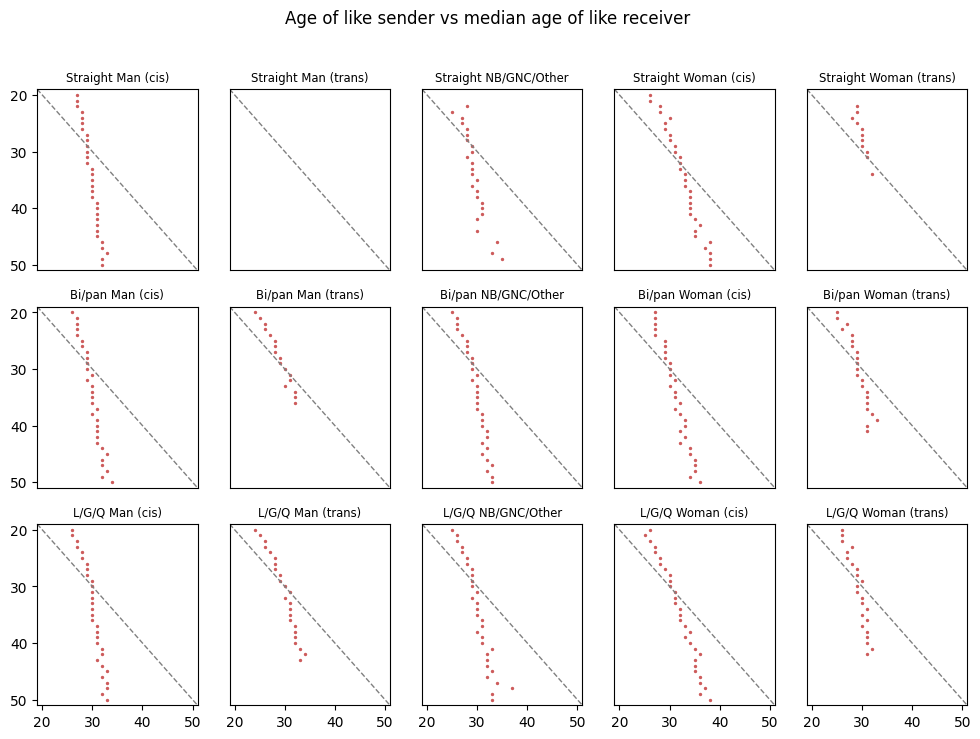
First, notice the patterns of red dots are all actually pretty similar when you zoom out to this level. This echoes the point about straight, cis men and women not actually being so drastically different. No demographic here has a perfectly vertical line or a perfectly diagonal line; they’re all a combination. What distinguishes genders and sexualities is a matter of degree of difference, not overall pattern.
Second, there are a lot of missing dots and even an empty chart for straight, trans men. This gap in data from older trans men and women (across all sexualities) may reflect generational differences in identity language, lower representation in digital spaces, or the impact of systemic inequalities—like historically-reduced life expectancy for trans men and women. Whether due to visibility, access, or choice, the absence is notable—and worth further exploration.
Third, you may notice that within a column all three rows tend to have similar patterns. The difference in patterns is more pronounced between genders than sexualities. Straight, bi/pan, and gay/queer men all have patterns more similar to each other as men than they do with women of the same sexuality. Put another way, gender is a stronger differentiator in age preferences than sexuality.
Finally, notice the average age of like receivers: around 29 for pretty much all demographics. 29 is the most attractive age on Feeld across all genders and sexualities. For the statistics nerds out there, you can literally see the regression to this mean for all demographics.
These charts represent what people are interested in, but how does this compare to their stated age preferences?
Do as I say, not as I do
On Feeld, members have the option to set their age preferences explicitly. We’ve seen a lot about which age groups actually get liked. Does that match what Feeld community members say they like?
Here is the same chart for straight, cis men as before, but with their average age preferences overlaid in gray.
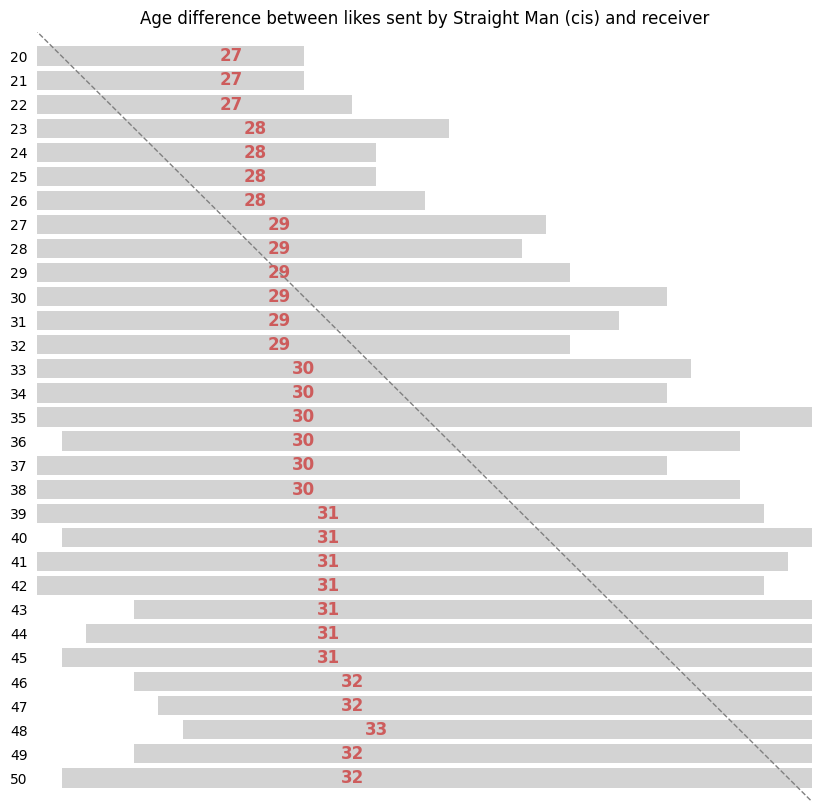
It kind of looks like a stack of books pushed up against a wall: as men age, the lower end of their range doesn’t go up much, they just change the upper end of the range to be higher. 50-year-old men have the same lower end of their range as 20-year-old men, they just extend the upper end.
Interestingly, the ages they send likes to (in red) mostly are not at the center of their age range preferences. Young, straight, cis men send likes to people at the upper end of their range. As they get into their late 20s and early 30s, they send likes to people in the middle of their range (who are also similar in age to themselves). By the time they are in their 40s they are sending likes to people closer to the lower end of their range.
Here is the corresponding chart for straight, cis women on Feeld.
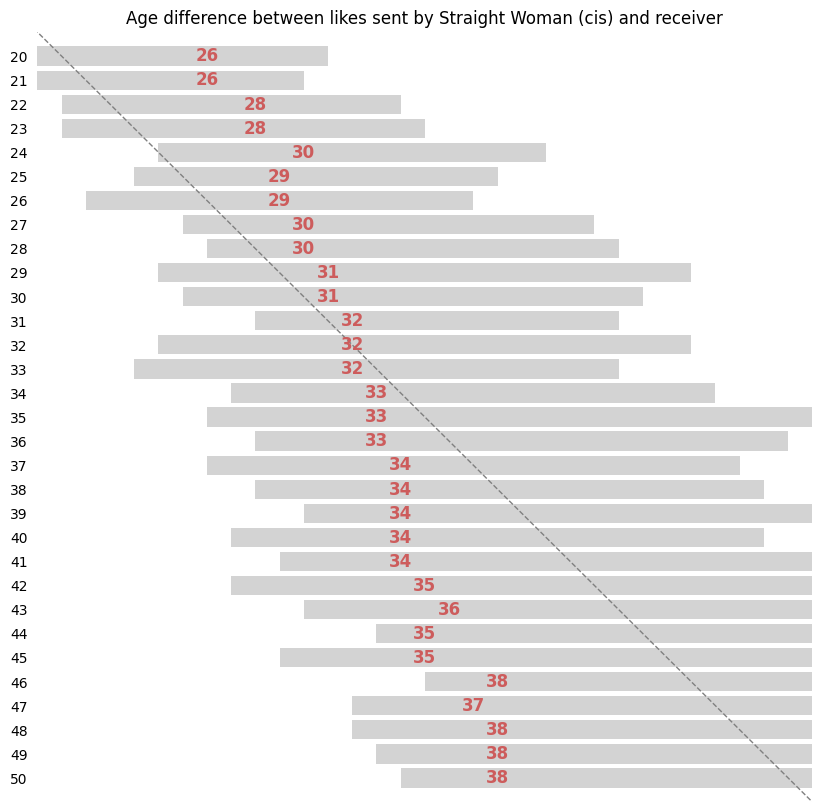
The most obvious difference is that these women’s age preference bands follow them as they themselves age. Instead of keeping the lower range the same and extending the higher end, these women are actively adjusting the lower and upper ranges up with their own age.
Notably, these women tend to send likes to people at the lower end of their range at all ages past 26 or so.
Here’s the zoomed out, high-level view of all genders and sexualities.
Again, you can see that patterns are more similar within a gender (column) than a sexuality (row). That is, men of all sexualities have similar age band preferences which are different from those of women of all sexualities.
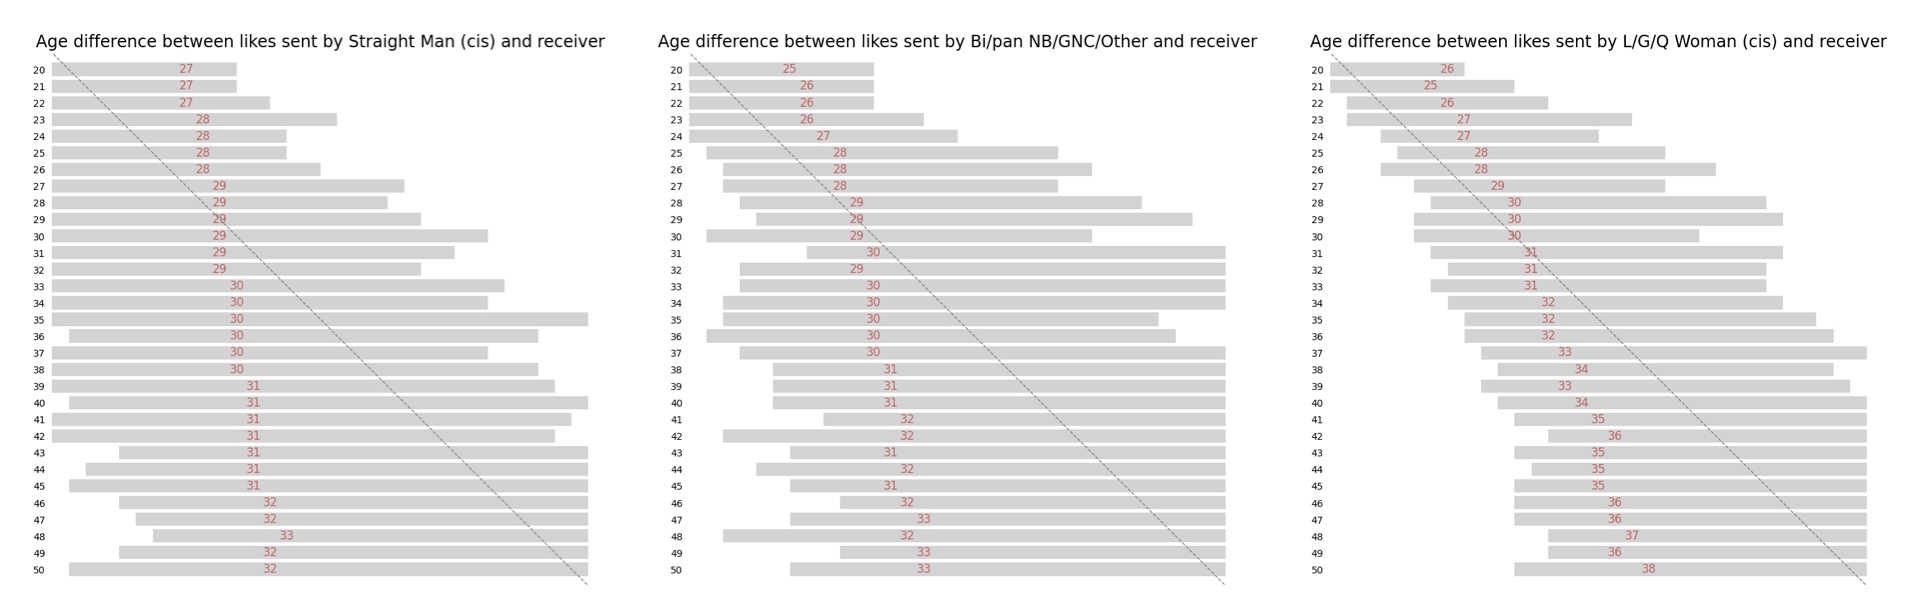
Notice that straight, cis men have the widest age preference bands that age up with them the least, followed by bi/pan non-binary/gender-nonconforming people, followed by lesbian/queer cis women.
You can also see that every demographic sends likes to those at the lower end of their age preferences. We say we’re more interested in older people than we actually are.
Forever 29
Throughout every single demographic we see the same pattern: Feeld members in their early to mid-20s send likes to people a few years older than them. As they get into their late 20s to early 30s they send likes to those their own age. As they age out of their 30s and beyond they send likes to younger members. Regardless of their age settings in-app, nearly everyone loves a 29-year-old, which is fantastic news for Gen Z Feelders.